“An indicator quantifies and simplifies phenomena and helps us understand complex realities. Indicators are aggregates of raw and processed data but they can be further aggregated to form complex indices.”
Definition by International Institute for Sustainable Development (IISD)
Purposes:
Indicators need to supply information on environmental problems. They identify key factors of the chosen topic and rate them. Indicators help us in decision making processes, like what do we need to do to mitigate this environmental problem. Once decision are made, indicators also help us to monitor the effects of our solutions. Did we really improve the situation or not? What else do we need to do or can we apply our solution for another problem?
What makes a good indicator of sustainability?
- Address carrying capacity – Whether the community is using resources at a rate faster than they are being renewed or restored.
- Relevant to community – Communities should select indicators that are relevant to their situations.
- Understandable to the community
- Useable by the community – If indicators are not used by the community, they will not have any effect on what people do.
- Long term view – Sustainability is a long term goal. We need long term indicators.
- Show linkages – Traditional indicators tend to be narrowly focused on one aspect of a community.
- Be relevant
- Be able to measure that we want to measure
- Identify key factors of the phenomena/ strategy/ project
- Give a clear informations
- Quantify and simplify complex phenomena
- Be feasible and practical to be collected and/or implemented
- Be a target reference
- Be qualitative/ quantitative
- Measure raw data or aggregated information
- Be a political target or represent a political priority
- Address strategies and political targets
- Evaluate or monitor the effect of the strategies and political actions
Index
An index is a group of indicators aggregated into a single value.
Environmental Sustainability Index (ESI)
- Tracks 21 elements of environmental sustainability covering natural resource endowments, past and present pollution levels, environmental management efforts, contributions to protection of the global commons, and a society’s capacity to improve its environmental performance over time
- The “ESI score quantifies the likelihood that a country will be able to preserve valuable environmental resources effectively over the period of several decades” (Esty et al., 2005).
- Weakness:
Framework has changed too often, the calculated indexes of different years are not comparable
Environmental Performance Index (EPI)
The EPI is divided in two areas of consideration. One is called the protection of human health and the other is called the protection of ecosystems. Within the two areas there are more than 20 indicators included.
Countries are rated and ranked by their environmental performance on each indicator. With the EPI we can see how close countries are of reaching a goal (proximity-to-target method), that is set by the indicators. For example if every citizent of a countrie has access to drinking water/sanitation or how good the air quality is in that country. The EPI can help low ranked countries by giving insights on best practices examples and by providing guidance to better their score. The overall aim is to shape data-driven environmental policymaking.
Happy Planet Index (HPI)
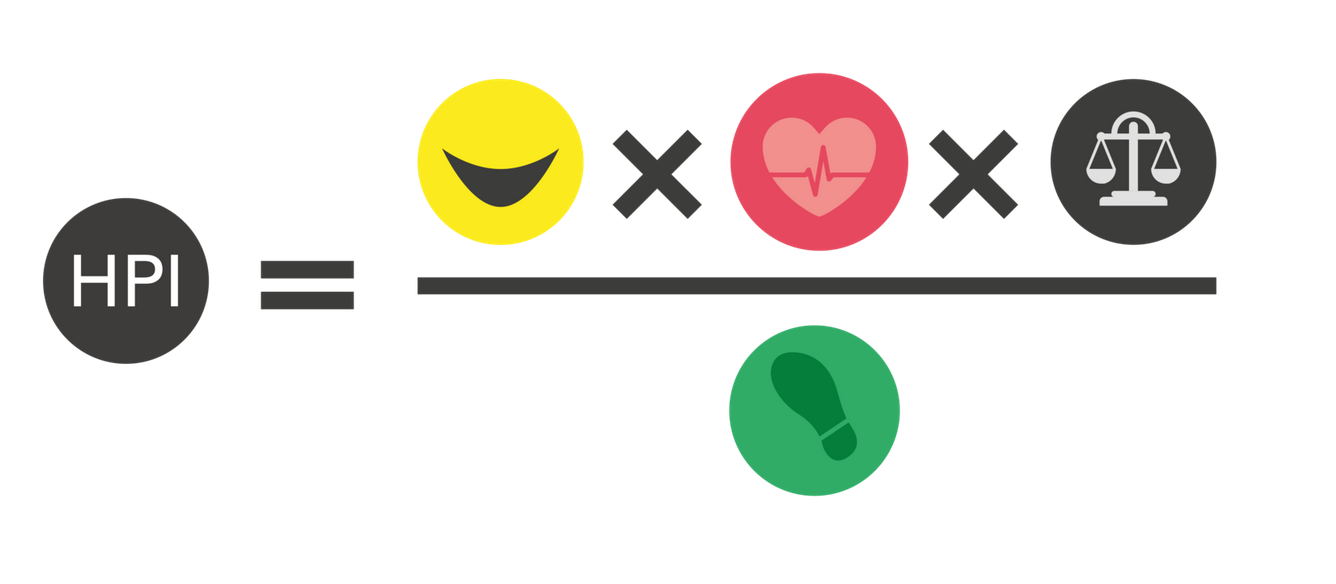
The HPI measures the sustainable wellbeing for all. It tells us how well nations are doing at achieving long, happy and sustainable lives. The Happy Planet Index provides a compass to guide nations, and shows that it is possible to live good lives without costing the Earth.
And how do we calculate the HPI?


The index consideres four areas:
Wellbeing: How satisfied the residents of each country say they feel with life overall, on a scale from zero to ten, based on data collected as part of the Gallup World Poll.
Life expectancy: The average number of years a person is expected to live in each country based on data collected by the United Nations.
Inequality of outcomes: The inequalities between people within a country, in terms of how long they live, and how happy they feel, based on the distribution in each country’s life expectancy and wellbeing data. Inequality of outcomes is expressed as a percentage.
Ecological footprint: The average impact that each resident of a country places on the environment, based on data prepared by the Global Footprint Network. Ecological Footprint is expressed using a standardized unit: global hectares (gha) per person.
Human development Index (HDI)
The HDI consideres three areas, the first one is long and healty life which is given by the expectancy at birth in a country. The second factor considered is education, here the index looks at how many years an adult of 25 years goes in average to school and the expected years of schooling for children of school entering age. The third and last factor includes livind standarts, in other words the gross national income per capita of a country.
Reflection
What is an Indicator and why do we need them?
Which characteristic must an indicator have?
Which characteristic could an indicator have?
What are the differences between an indicator and an index?
Why do we need an Index?
What is EPI?
